SELECTED MEASURES OF EFFECTIVENESS
In Fall 2021, we chose a range of measures that align with the corridor goals to evaluate how each alternative performs. Additionally, we performed modeling to project the ridership and transit system effect each alternative would have. Here is a summary of what we've learned:
|
ALTERNATIVES
|
1
|
2
|
3
|
4
|
5
|
6
|
7
|
|
|
|
Mode
|
LRT
|
BRT
|
BRT
|
HRT
|
BRT
|
LRT
|
BRT
|
|
|
|
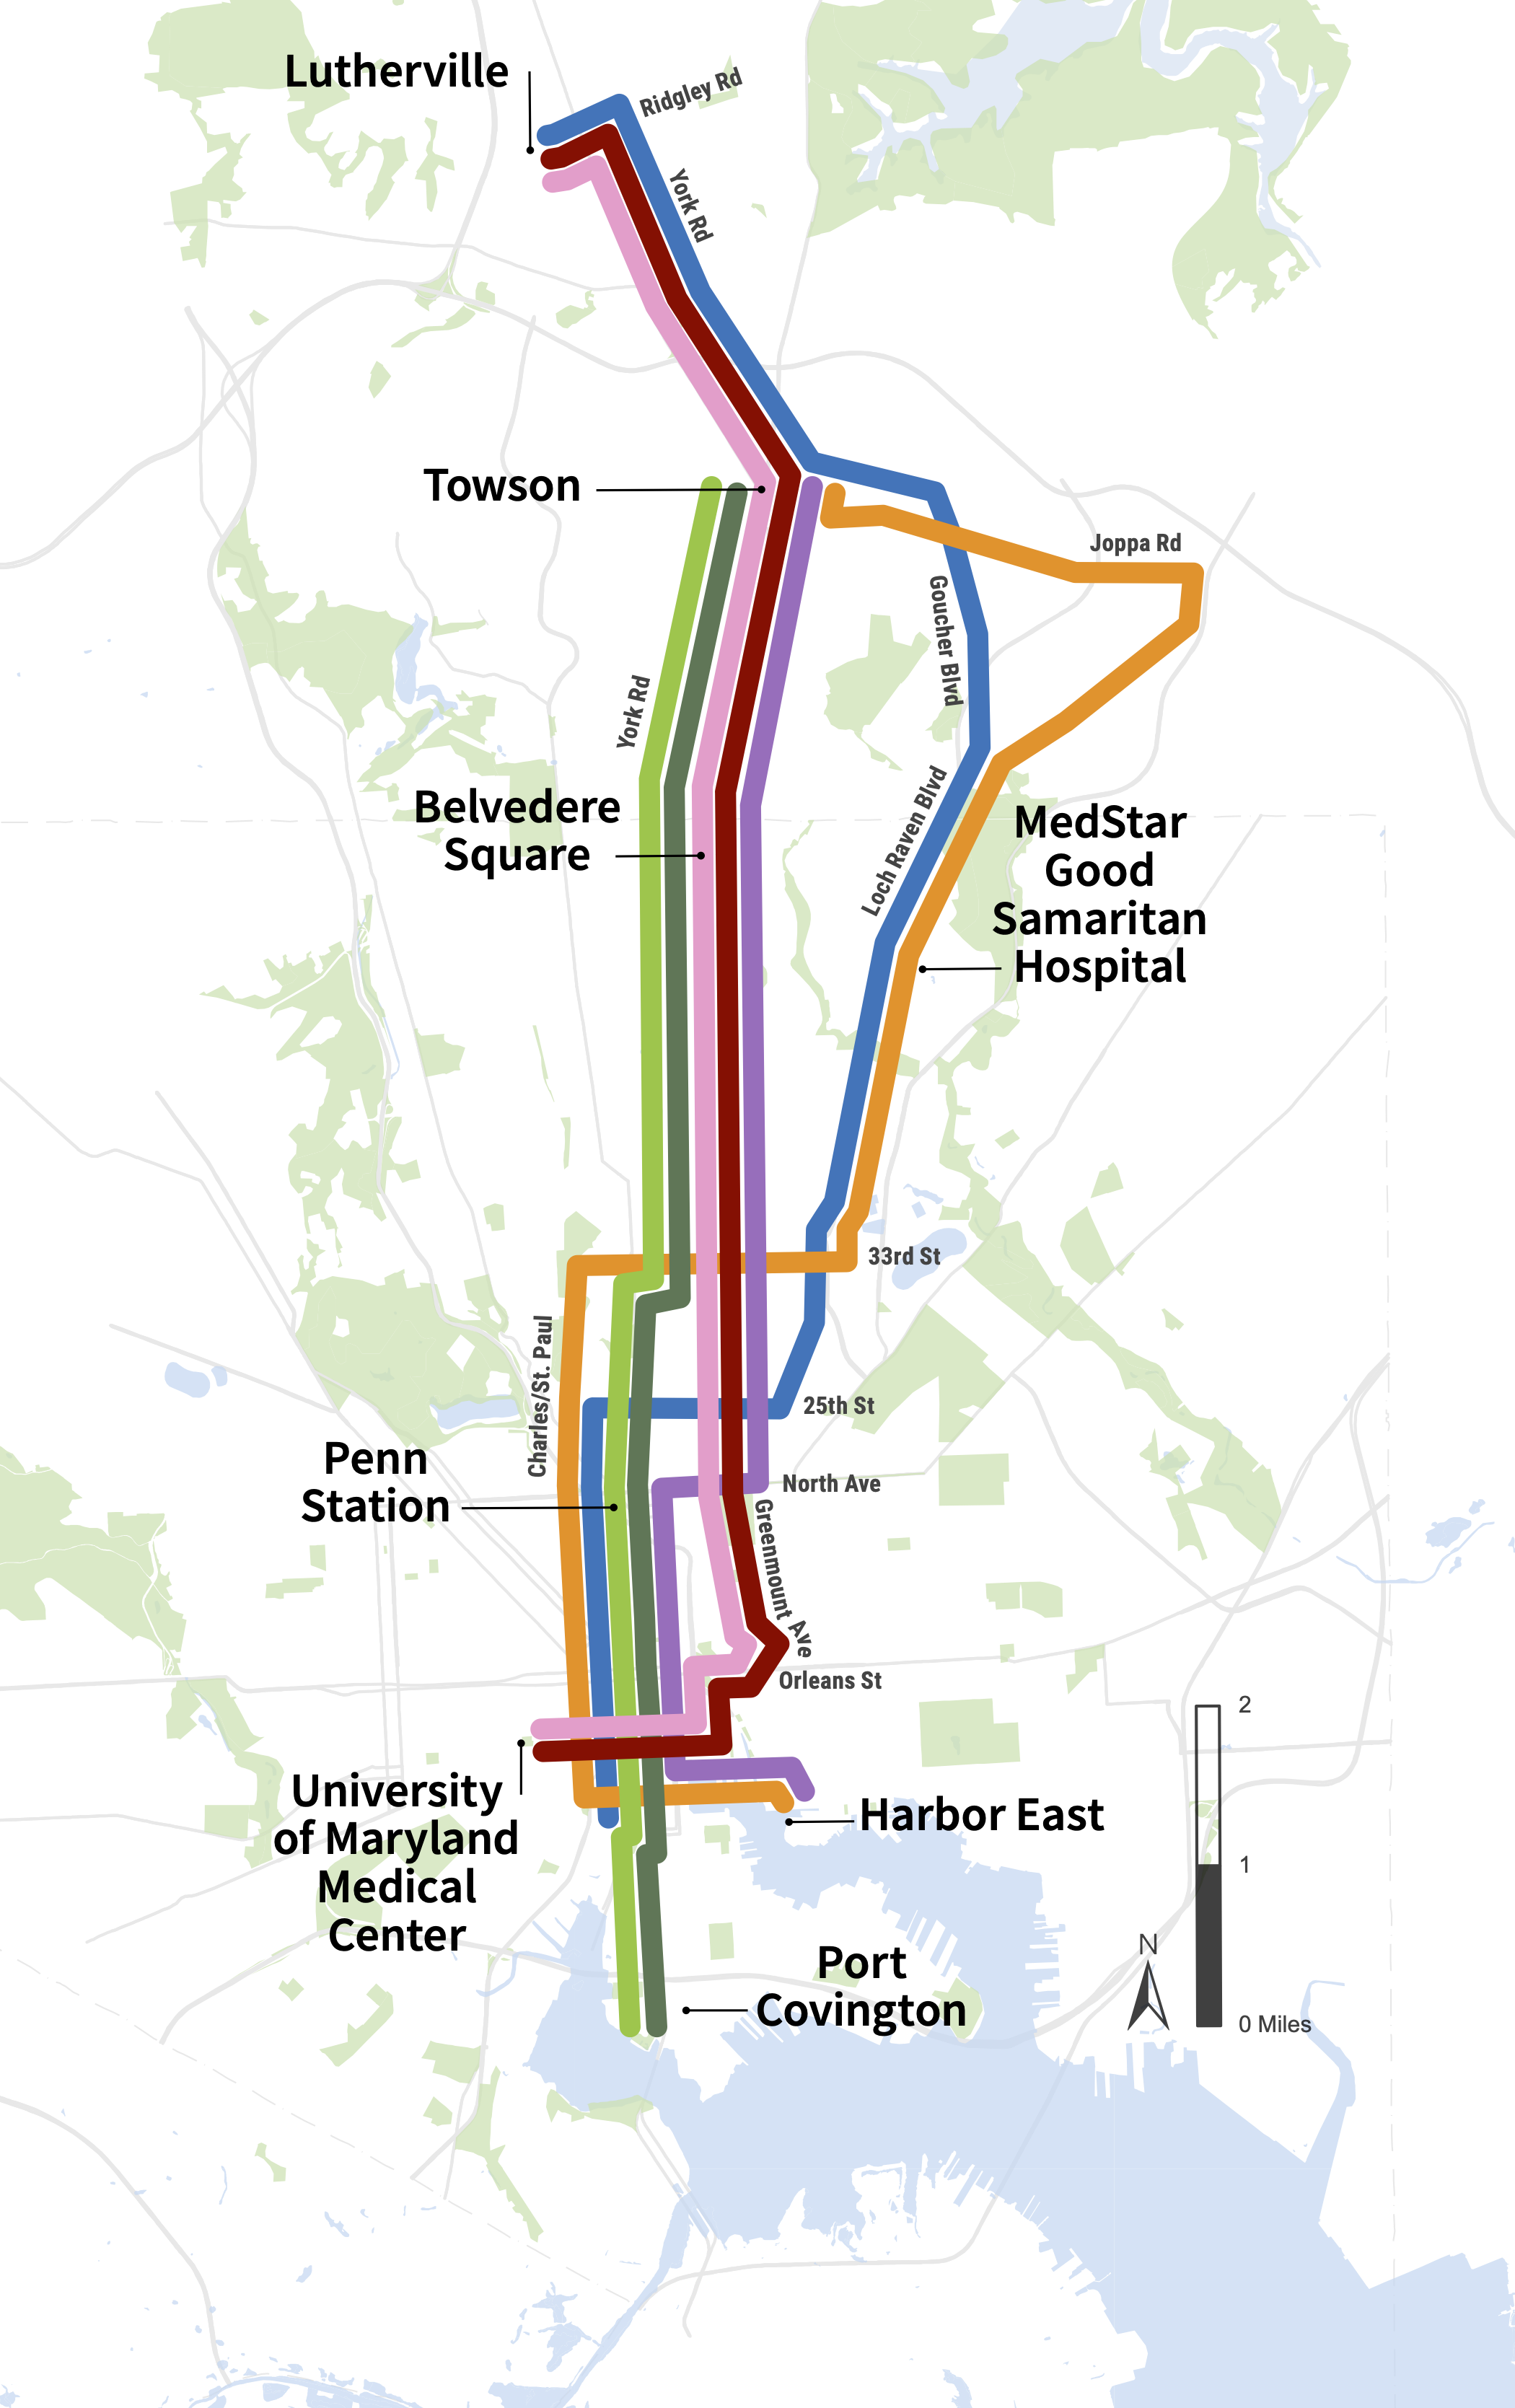
Endpoints
|
Lutherville - UMMC
|
Lutherville - UMMC
|
Towson - Harbor East
|
Towson - Port Covington
|
Towson - Port Covington
|
Lutherville - Otterbein
|
Towson - Harbor East
|
|
|
|
Length
|
11.6
|
11.5
|
9.2
|
10.5
|
10.4
|
12.5
|
12.6
|
|
|
|
Number of Stations
|
21
|
33
|
28
|
9
|
30
|
25
|
32
|
|
|
|
Average Station Spacing (miles)
|
0.6
|
0.3
|
0.3
|
1.2
|
0.3
|
0.5
|
0.4
|
|
Goal
|
Theme
|
Measure of Effectiveness
|
Comparison
|
Comparison
|
Comparison
|
Comparison
|
Comparison
|
Comparison
|
Comparison
|

Increase mobility and access to jobs, services, and other opportunities in the region
|
Reliability
|
Percent of dedicated or separated guideway
|
GOOD
|
BETTER
|
BETTER
|
BEST
|
BETTER
|
BETTER
|
BEST
|
|
Fixed or Flexible Guideway
|
FIXED
|
FLEXIBLE
|
FLEXIBLE
|
FIXED
|
FLEXIBLE
|
FIXED
|
FLEXIBLE
|
|
Travel Time Savings
|
Transit travel time savings between Towson and Downtown Baltimore (minutes)
|
BEST
|
BETTER
|
BETTER
|
BEST
|
BETTER
|
GOOD
|
GOOD
|
|
Access
|
Households within 1/2 mile of a station, per mile
|
BETTER
|
BETTER
|
BEST
|
GOOD
|
BEST
|
BETTER
|
BETTER
|
|
Student population within 1/2 mile of a station per mile
|
BETTER
|
BETTER
|
BEST
|
GOOD
|
BEST
|
GOOD
|
BETTER
|
|
Future jobs within 1/2 mile of a station per mile
|
BETTER
|
BEST
|
BEST
|
GOOD
|
BETTER
|
BETTER
|
BETTER
|

Create strategic connection to multi-modal transportation options locally and regionally
|
Connections
|
Connections to rail stations, frequent bus routes, and locally operated transit routes
|
BETTER
|
BEST
|
BETTER
|
GOOD
|
GOOD
|
BETTER
|
GOOD
|
|
Additional future jobs accessible by transit within 45 minutes
|
BEST
|
BETTER
|
BETTER
|
GOOD
|
GOOD
|
GOOD
|
BETTER
|

Center equity as a core consideration
|
Equity 1
|
All transit-critical populations within 1/2 mile of a station, per mile
|
BETTER
|
BETTER
|
BEST
|
GOOD
|
BETTER
|
BETTER
|
BETTER
|

Support the region's economic competitiveness and strategic growth
|
Cost
|
Capital cost
|
$$$
|
$
|
$
|
$$$
|
$
|
$$
|
$
|
|
Development Opportunity
|
Transit-Oriented Development and Opportunity Zones within 1/2 mile of station
|
BETTER
|
GOOD
|
GOOD
|
GOOD
|
BEST
|
BETTER
|
BETTER
|
|
Implementation
|
Implementation time
|
MIDDLE
|
SHORTEST
|
SHORTEST
|
LONGEST
|
SHORTEST
|
MIDDLE
|
SHORTEST
|
|
Bridge and Tunnel Complexity
|
MEDIUM
|
N/A
|
N/A
|
HIGH
|
N/A
|
MEDIUM
|
N/A
|
|
Support the regions sustainability goals.
|
Ridership
|
Projected daily boardings in 2045, per mile
|
BETTER
|
BETTER
|
BEST
|
GOOD
|
BEST
|
BETTER
|
BETTER
|
|
Sustainability
|
Zero-car households within ½ mile of a station, per mile
|
BETTER
|
BETTER
|
BETTER
|
GOOD
|
BETTER
|
BETTER
|
BEST
|
1 Sum of low-income, minority, limited English proficiency, and 65+ populations, people with disabilities, and zero-car households within 1/2 mile of a station, per mile. People/households may be counted more than once if they're part of multiple transit-critical groups.
DOWNLOAD THE COMPLETE MEASURES OF EFFECTIVENESS REPORT
VISIT OUR FAQ PAGE